Understanding your numbers and what to do with them
What’s on the Dashboard
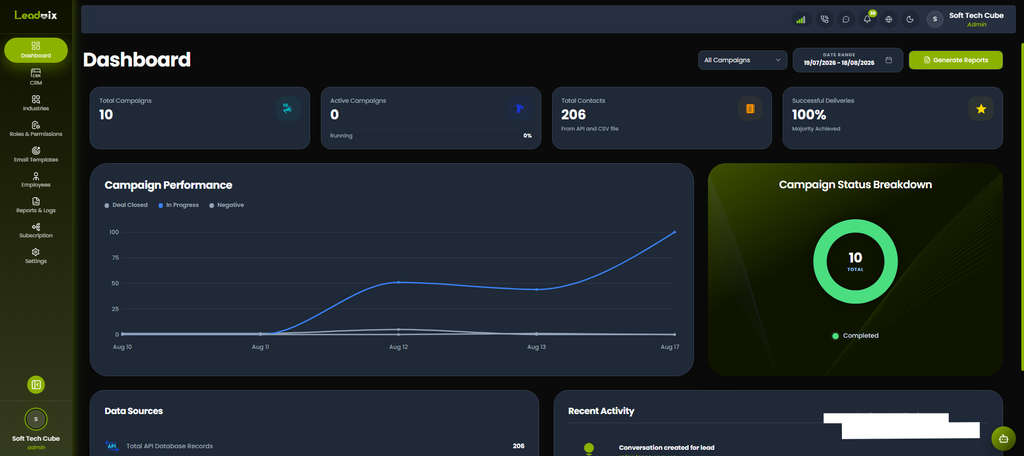
Click Dashboard in the left sidebar. At the top, you’ll see 4 summary cards:
| Card | What It Shows |
| Total Campaigns | How many campaigns you’ve created in total |
| Active Campaigns | Campaigns currently running — shows % progress |
| Total Contacts | Total leads in your account from API and CSV imports |
| Successful Deliveries | Email delivery success rate — e.g. 100% Majority Achieved |
At the top right you’ll find:
- All Campaigns dropdown — filter the dashboard by a specific campaign
- Date Range — set a custom date range for the data shown
- Generate Reports button — export a report for the selected period
Campaign Performance Chart
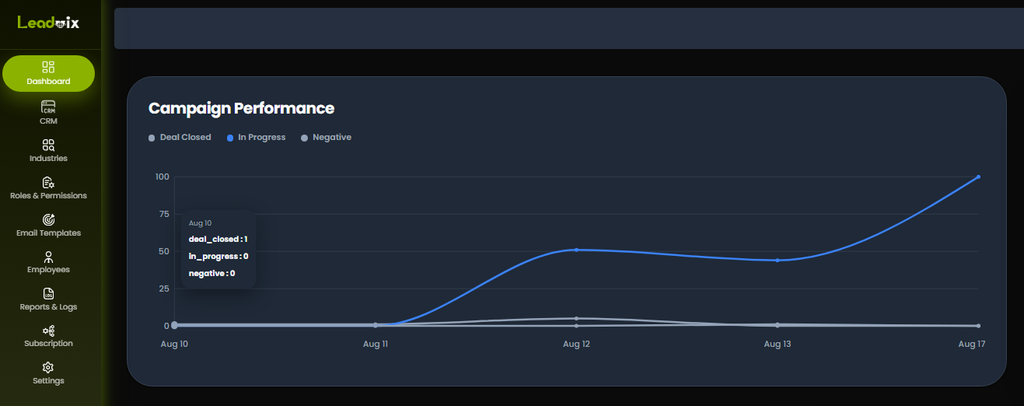
The main chart shows Campaign Performance over time with three lines:
- 🔵 In Progress — leads currently being worked on
- ⚪ Deal Closed — leads that converted
- ⚫ Negative — leads that didn’t respond or declined
Hover over any point on the chart to see a breakdown for that specific date, for example:
- deal_closed: 1
- in_progress: 0
- negative: 0
This tells you exactly how your pipeline moved on any given day.
Campaign Status Breakdown
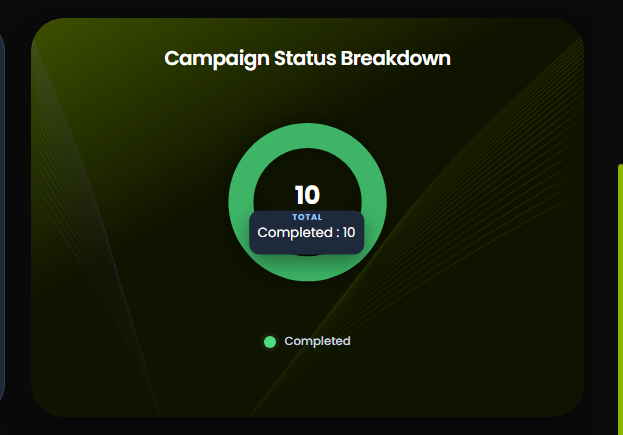
To the right of the performance chart is the Campaign Status Breakdown, a donut chart showing the total number of campaigns and their completion status.
In the example shown:
- 10 Total campaigns
- All showing as Completed (green)
Data Sources
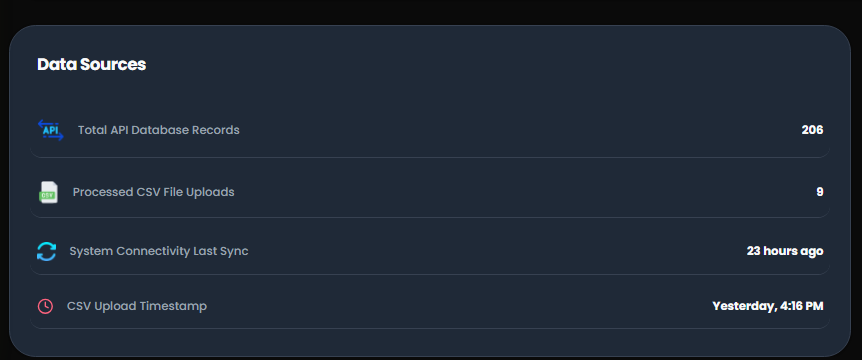
Below the chart on the left is the Data Sources panel:
| Field | What It Shows |
| Total API Database Records | Total leads pulled from API — e.g. 106 |
| Processed CSV File Uploads | Number of CSV files imported — e.g. 7 |
| System Connectivity Last Sync | When the system last synced — e.g. 2026-08-12, 3:37 PM |
| CSV Upload Timestamp | When the last CSV was uploaded |
This confirms your lead data is being processed and synced correctly.
Recent Activity
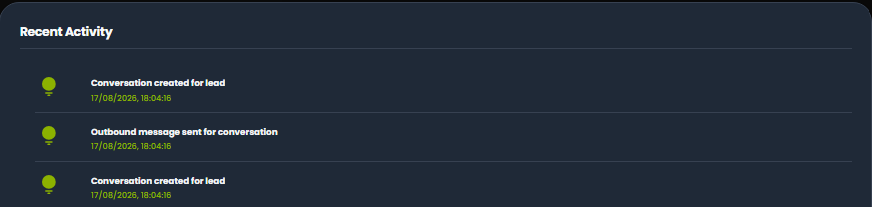
To the right of Data Sources is the Recent Activity feed a real-time log of everything happening in your account.
This is the fastest way to see what’s happening across all your campaigns without opening each one individually.
Reports & Logs
For a deeper dive, click Reports & Logs in the left sidebar. This gives you a full breakdown of campaign activity, including emails sent, replies received, AI classifications, and status changes all in one place.
Use the Generate Reports button on the Dashboard to export data for a specific date range and campaign.
Frequently Asked Questions (FAQs)
What does Successful Deliveries 100% mean?
It means all emails sent in that period were successfully delivered to recipients’ mail servers. It does not mean they were opened or replied to just that delivery was successful.
How do I filter the dashboard by a specific campaign?
Use the All Campaigns dropdown at the top right of the Dashboard. Select any campaign to see its specific data.
How often does the Dashboard update?
The Dashboard updates in real time as campaign activity happens. The Data Sources panel shows the last sync time so you can confirm data is current.
Where do I go for a full campaign history?
Click Reports & Logs in the left sidebar for a complete activity log across all campaigns.